Guide · · 13 min read
Returns Management in Canada: A Practical Operations Guide for 2026
Returns are the most under-managed line in Canadian e-commerce. Here's how to think about return rates, processing economics, carrier strategy, and the operational decisions that turn reverse logistics from a margin leak into a brand asset.
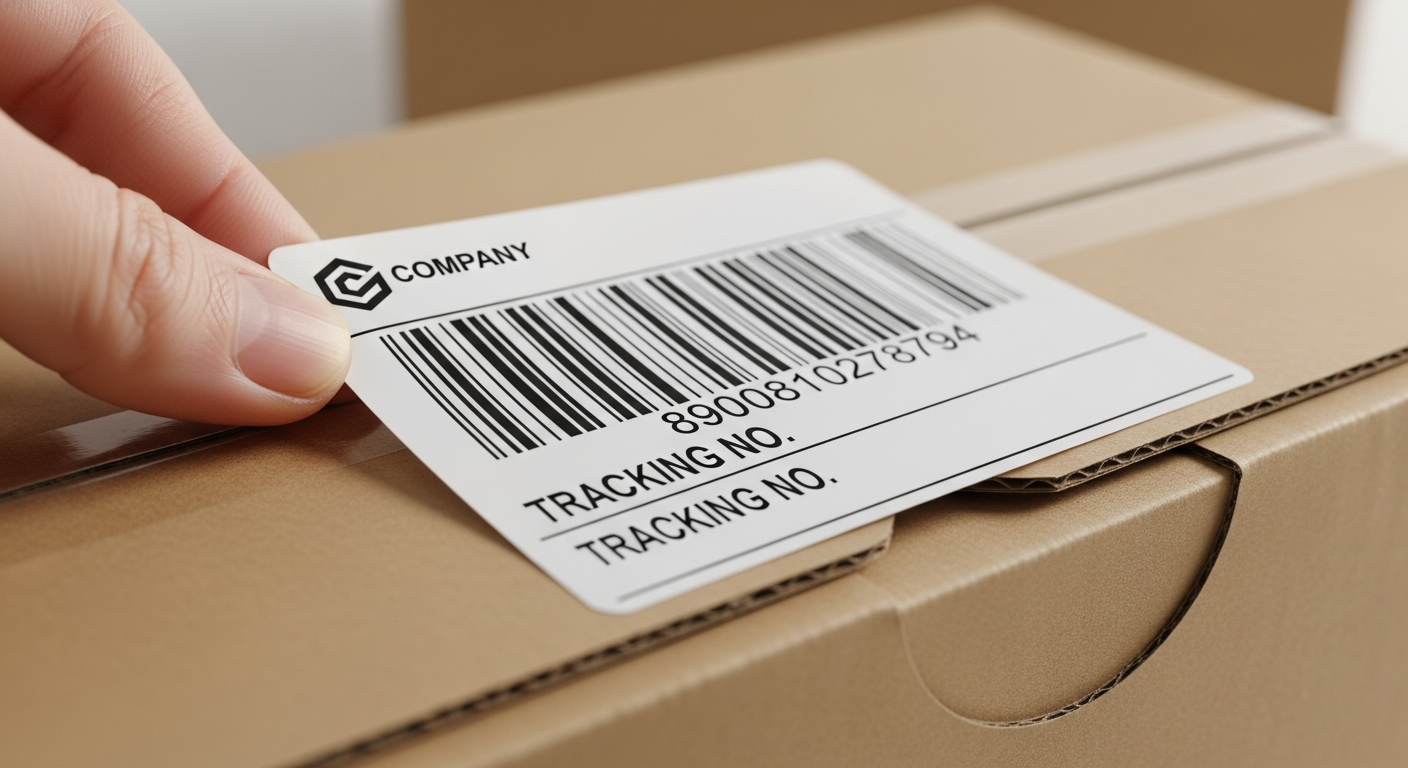
Returns are the single most under-managed cost line in Canadian e-commerce. Industry-wide, return rates run 12–25% of revenue depending on category — apparel runs above 30%, beauty closer to 8%, electronics around 12%. Most brands process returns as an afterthought: receive the parcel, restock if obvious, refund the customer, write off the rest. The brands that win on margin treat returns as an operational discipline with the same rigour as outbound fulfillment — and the difference between best-in-class and average returns operations frequently swings 3–5 points of net margin. This guide explains what returns actually cost, what to demand from a Canadian 3PL on returns, and how to think about reverse logistics as a competitive advantage rather than a cost centre.
What returns actually cost (the real number)
Most brands underestimate the all-in cost of a return by 40–60%. The visible cost is straightforward: return shipping ($8–$18 for a typical Canadian return label), receive and inspect ($3–$7 at most 3PLs), restock or grade ($1–$4), and refund processing fees from the payment processor. The invisible costs are larger and rarely tracked: cost of capital tied up in the returned-but-not-yet-restocked inventory; depreciation on returned product that cannot be sold as new (apparel especially loses 15–40% of value once returned); customer service time handling the return inquiry; and the lift on customer acquisition cost when high-return-rate customers are subsidized by low-return-rate customers. The true all-in return cost in Canadian apparel typically runs $28–$55 per returned order — far more than the visible $12–$25 most brands account for.
Track returns at the SKU level, not the order level. Brands that look only at aggregate return rate miss the 80/20 problem: typically 15–25% of SKUs drive 60–75% of returns. SKU-level data lets you fix product or merchandising problems rather than just absorbing costs.
Return rate benchmarks by category
Knowing where your category sits is essential because it determines what 'good' looks like for your operation. The bands below reflect 2026 Canadian e-commerce data across DTC and B2C marketplaces. Above-band return rates almost always indicate one of three problems: sizing or fit issues (apparel, footwear), product description versus reality gaps (across all categories), or quality and consistency issues. A serious returns operation reports rates by SKU, by acquisition channel, and by customer cohort — not just an aggregate brand-level number.
| Category | Average Return Rate | Best-in-Class |
|---|
| Apparel & footwear | 25 – 35% | < 18% |
| Beauty & personal care | 5 – 10% | < 5% |
| Consumer electronics | 10 – 15% | < 8% |
| Home goods & furniture | 8 – 14% | < 6% |
| Pet products | 4 – 8% | < 3% |
| Supplements & health | 3 – 7% | < 3% |
| Subscription boxes | 2 – 5% | < 2% |
| Auto parts & accessories | 8 – 14% | < 6% |
The standard returns process — and where most go wrong
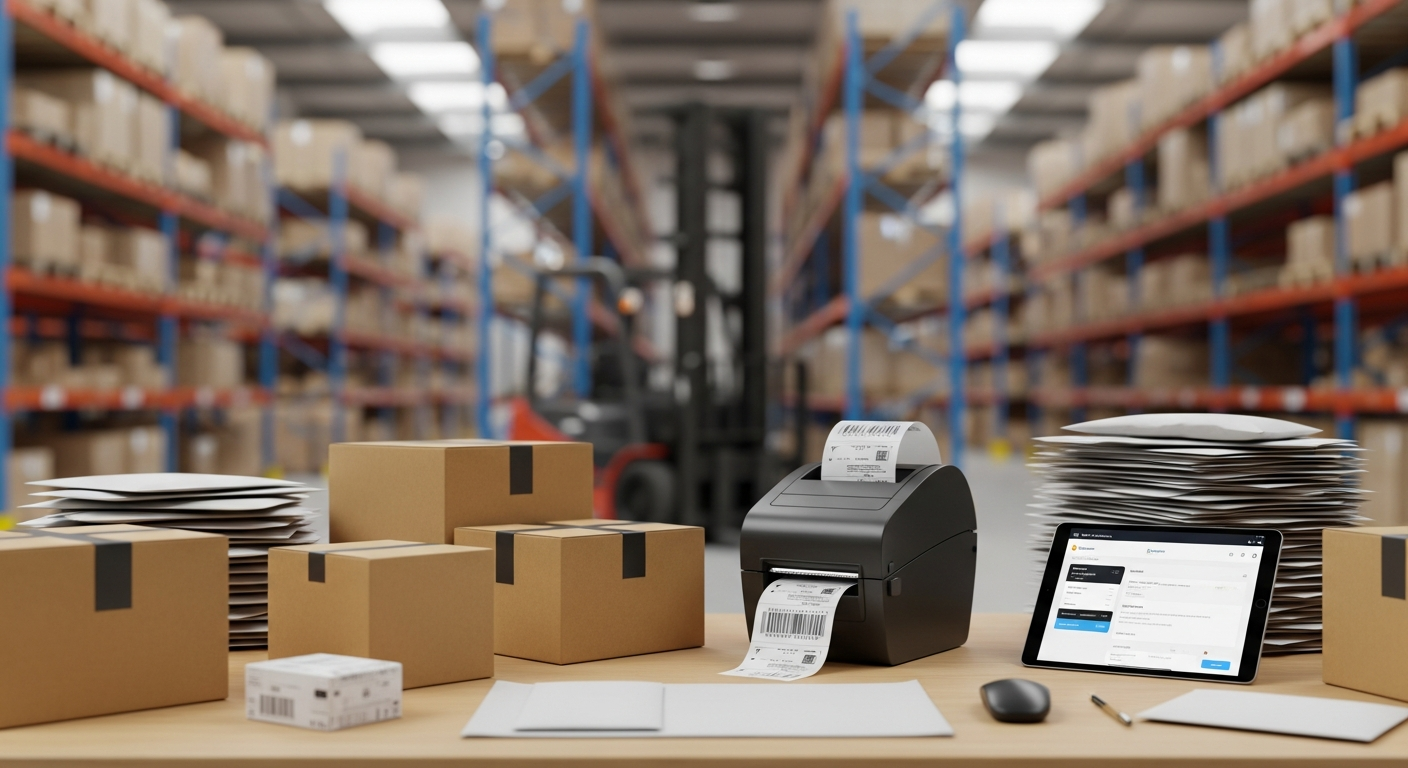
A well-run returns process has eight distinct steps: customer initiates return through a portal; system validates eligibility against return policy; pre-paid return label is generated; customer drops off or schedules pickup; carrier delivers to the 3PL; 3PL receives and triages; inspection determines disposition (restock, refurbish, liquidate, dispose); inventory and refund systems update. Most brand operators only see steps one and eight, which is exactly the problem. The operational quality of steps four through seven determines whether returns are a 6-day cycle or a 21-day cycle, whether 70% of returned product gets restocked or 40%, and whether the customer's refund hits in 3 days or 14. Each of those gaps is real money and real customer satisfaction impact.
 The standard returns process — and where most go wrong
Returns carrier strategy in Canada
Most brands default to a single return carrier (often Canada Post because of community drop-off density) and miss the optimization opportunity. A serious returns program rate-shops return labels just like outbound shipments. Canada Post still wins on consumer convenience and rural coverage. UPS and Purolator typically beat Canada Post on cost for urban dense returns and offer better tracking. Intelcom and FlashBox have made aggressive moves into urban Canadian returns with same-day or next-day pickup at consumer-friendly price points. For high-volume brands, dedicated returns aggregators (Returnly, Loop, AfterShip) layered on top of the carrier mix can cut return shipping cost 12–25% while improving customer experience.
- Canada Post: best community drop-off density, strong rural coverage, slower urban transit
- UPS / Purolator: faster urban returns, better tracking, higher per-label cost
- FedEx: strong cross-border return capability for U.S.-purchased Canadian returns
- Intelcom / FlashBox: urban-density returns at competitive rates in Quebec and Ontario
- Returns aggregators (Returnly, Loop): consolidated label generation across carrier mix
Disposition: what to do with the returned inventory
The single biggest opportunity in most Canadian returns operations is improving disposition decisions. Most 3PLs default-dispose returned inventory in two buckets: restock (it looks new) or write off (it doesn't). The brands that win economically have a more granular disposition framework with at least four buckets: restock as new (perfect condition, restored to original packaging, full price); restock as B-stock or open-box (functional but not visually new, sold at 15–30% discount through a separate channel); refurbish (light cleaning, repair, or repackaging brings it back to A-stock — typically 8–15% of returns can be economically refurbished); and liquidation or donation (everything else). Adding a B-stock channel and a refurbishment lane to your returns operation typically recovers 18–28% of margin that would otherwise be written off.
 Disposition: what to do with the returned inventory
Return policy as an operational decision (not just a marketing one)
Return policy is usually owned by marketing or merchandising, but it should be owned jointly with operations — because policy decisions drive operational reality. A 60-day window with free return shipping increases conversion 3–8% in most categories but increases return rate 15–25% versus a 30-day window with customer-paid shipping. Strict 'unworn, original tags, original packaging' policies reduce returns at the cost of lifetime value. Buy-online-return-in-store (BORIS) shifts cost from logistics to retail floor and only works if you have retail. The right return policy is the one that maximizes contribution margin per acquired customer, which is a different question for every brand and category — but it is a question, not a default.
Brands that publish a 'no questions asked' return policy and then deny returns through fine print see customer retention rates 25–40% below brands that publish a clear, slightly more restrictive policy and honour it. Operational integrity beats generous-but-inconsistent policy every time.
What to demand from a Canadian 3PL on returns
Most 3PLs treat returns as a profit centre with predictable per-return fees, low operational priority, and minimal data visibility. Hold your prospective 3PL to a higher standard. Ask: What is your average cycle time from return receipt to refund-issued (target: under 5 business days)? What is your inspection error rate (target: under 1.5%)? Can you generate disposition decisions per SKU at receipt and feed them back to my product team? Do you support B-stock and refurbishment lanes, or only restock-vs-dispose? Can your returns portal integrate with my e-commerce platform and customer service tools? Do you generate weekly SKU-level returns analytics? A 3PL that cannot answer these questions confidently is going to leak margin in your returns operation no matter how well their outbound runs.
How ByExpress runs returns
ByExpress operates returns processing as a first-class operational discipline at all five Canadian fulfillment locations. Standard service includes inspection, photographic documentation of damaged returns, multi-bucket disposition (restock-as-new, B-stock, refurbish, liquidation), SKU-level returns analytics fed back to brand teams weekly, and customer-facing returns portal integrations with Shopify, WooCommerce, BigCommerce, and Amazon Returns. Standard cycle time from return receipt to refund-eligible status runs 2–4 business days. For brands with category-specific returns complexity (apparel size/fit, beauty contamination handling, electronics functional testing), we customize the receiving and inspection workflow rather than forcing a one-size-fits-all process.
Frequently Asked Questions
What is the average return rate for Canadian e-commerce?
It varies dramatically by category: 25–35% for apparel and footwear, 5–10% for beauty, 10–15% for consumer electronics, 8–14% for home goods, 3–7% for supplements. Best-in-class operators in each category typically run 30–50% below the average, primarily through better product information, sizing tools, and quality control rather than restrictive return policies.
How much does it actually cost to process a return in Canada?
Visible cost is $12–$25 per return (return shipping, receive, inspect, restock). All-in cost including inventory depreciation, capital cost, customer service time, and write-offs typically runs $28–$55 per return for apparel and similar high-depreciation categories. Lower-depreciation categories (supplements, beauty) run $18–$30 all-in.
Should I offer free return shipping?
It depends on category and conversion sensitivity. Free returns increase conversion 3–8% and average order value modestly, but increase return rate 15–25% and adds direct cost. The right answer is usually category-specific: apparel and footwear typically need free returns to compete, while supplements, beauty, and electronics often perform better with customer-paid returns and a clear policy.
What is B-stock and should my brand offer it?
B-stock is returned product that is functional but not visually new — typically sold at 15–30% discount through a separate channel (your own outlet section, a B-stock-specific channel, or a liquidator). Adding a B-stock channel to your returns operation typically recovers 18–28% of margin that would otherwise be written off. It works best for products where condition affects perceived value but not functional value (electronics, home goods, beauty equipment).
What technology should a returns operation have?
At minimum: customer-facing returns portal, automated return label generation with multi-carrier support, scan-based receive and inspect workflow, multi-bucket disposition system, real-time inventory and refund integration, SKU-level analytics, and integration with customer service tools (Gorgias, Zendesk, Kustomer). Advanced operations layer in returns prediction (which orders are likely to return), return reason analytics, and refurbishment workflow.
How long should a return take to process?
Best-in-class is 2–4 business days from physical receipt to refund-eligible. Industry average is 5–10 business days. Anything above 14 days is a customer experience problem that drives bad reviews and lost lifetime value, regardless of the underlying logistics complexity.
Related ByExpress resources